

Insights
What your customers ask about, how they feel and how fast your team answers, from your help desk tickets.
Insights reads your help desk tickets: what customers ask about, how they feel and how fast your team answers. Most numbers open the tickets behind them. Owners and admins see it.
Insights needs a connected help desk. Without one it says Connect your helpdesk to see insights.
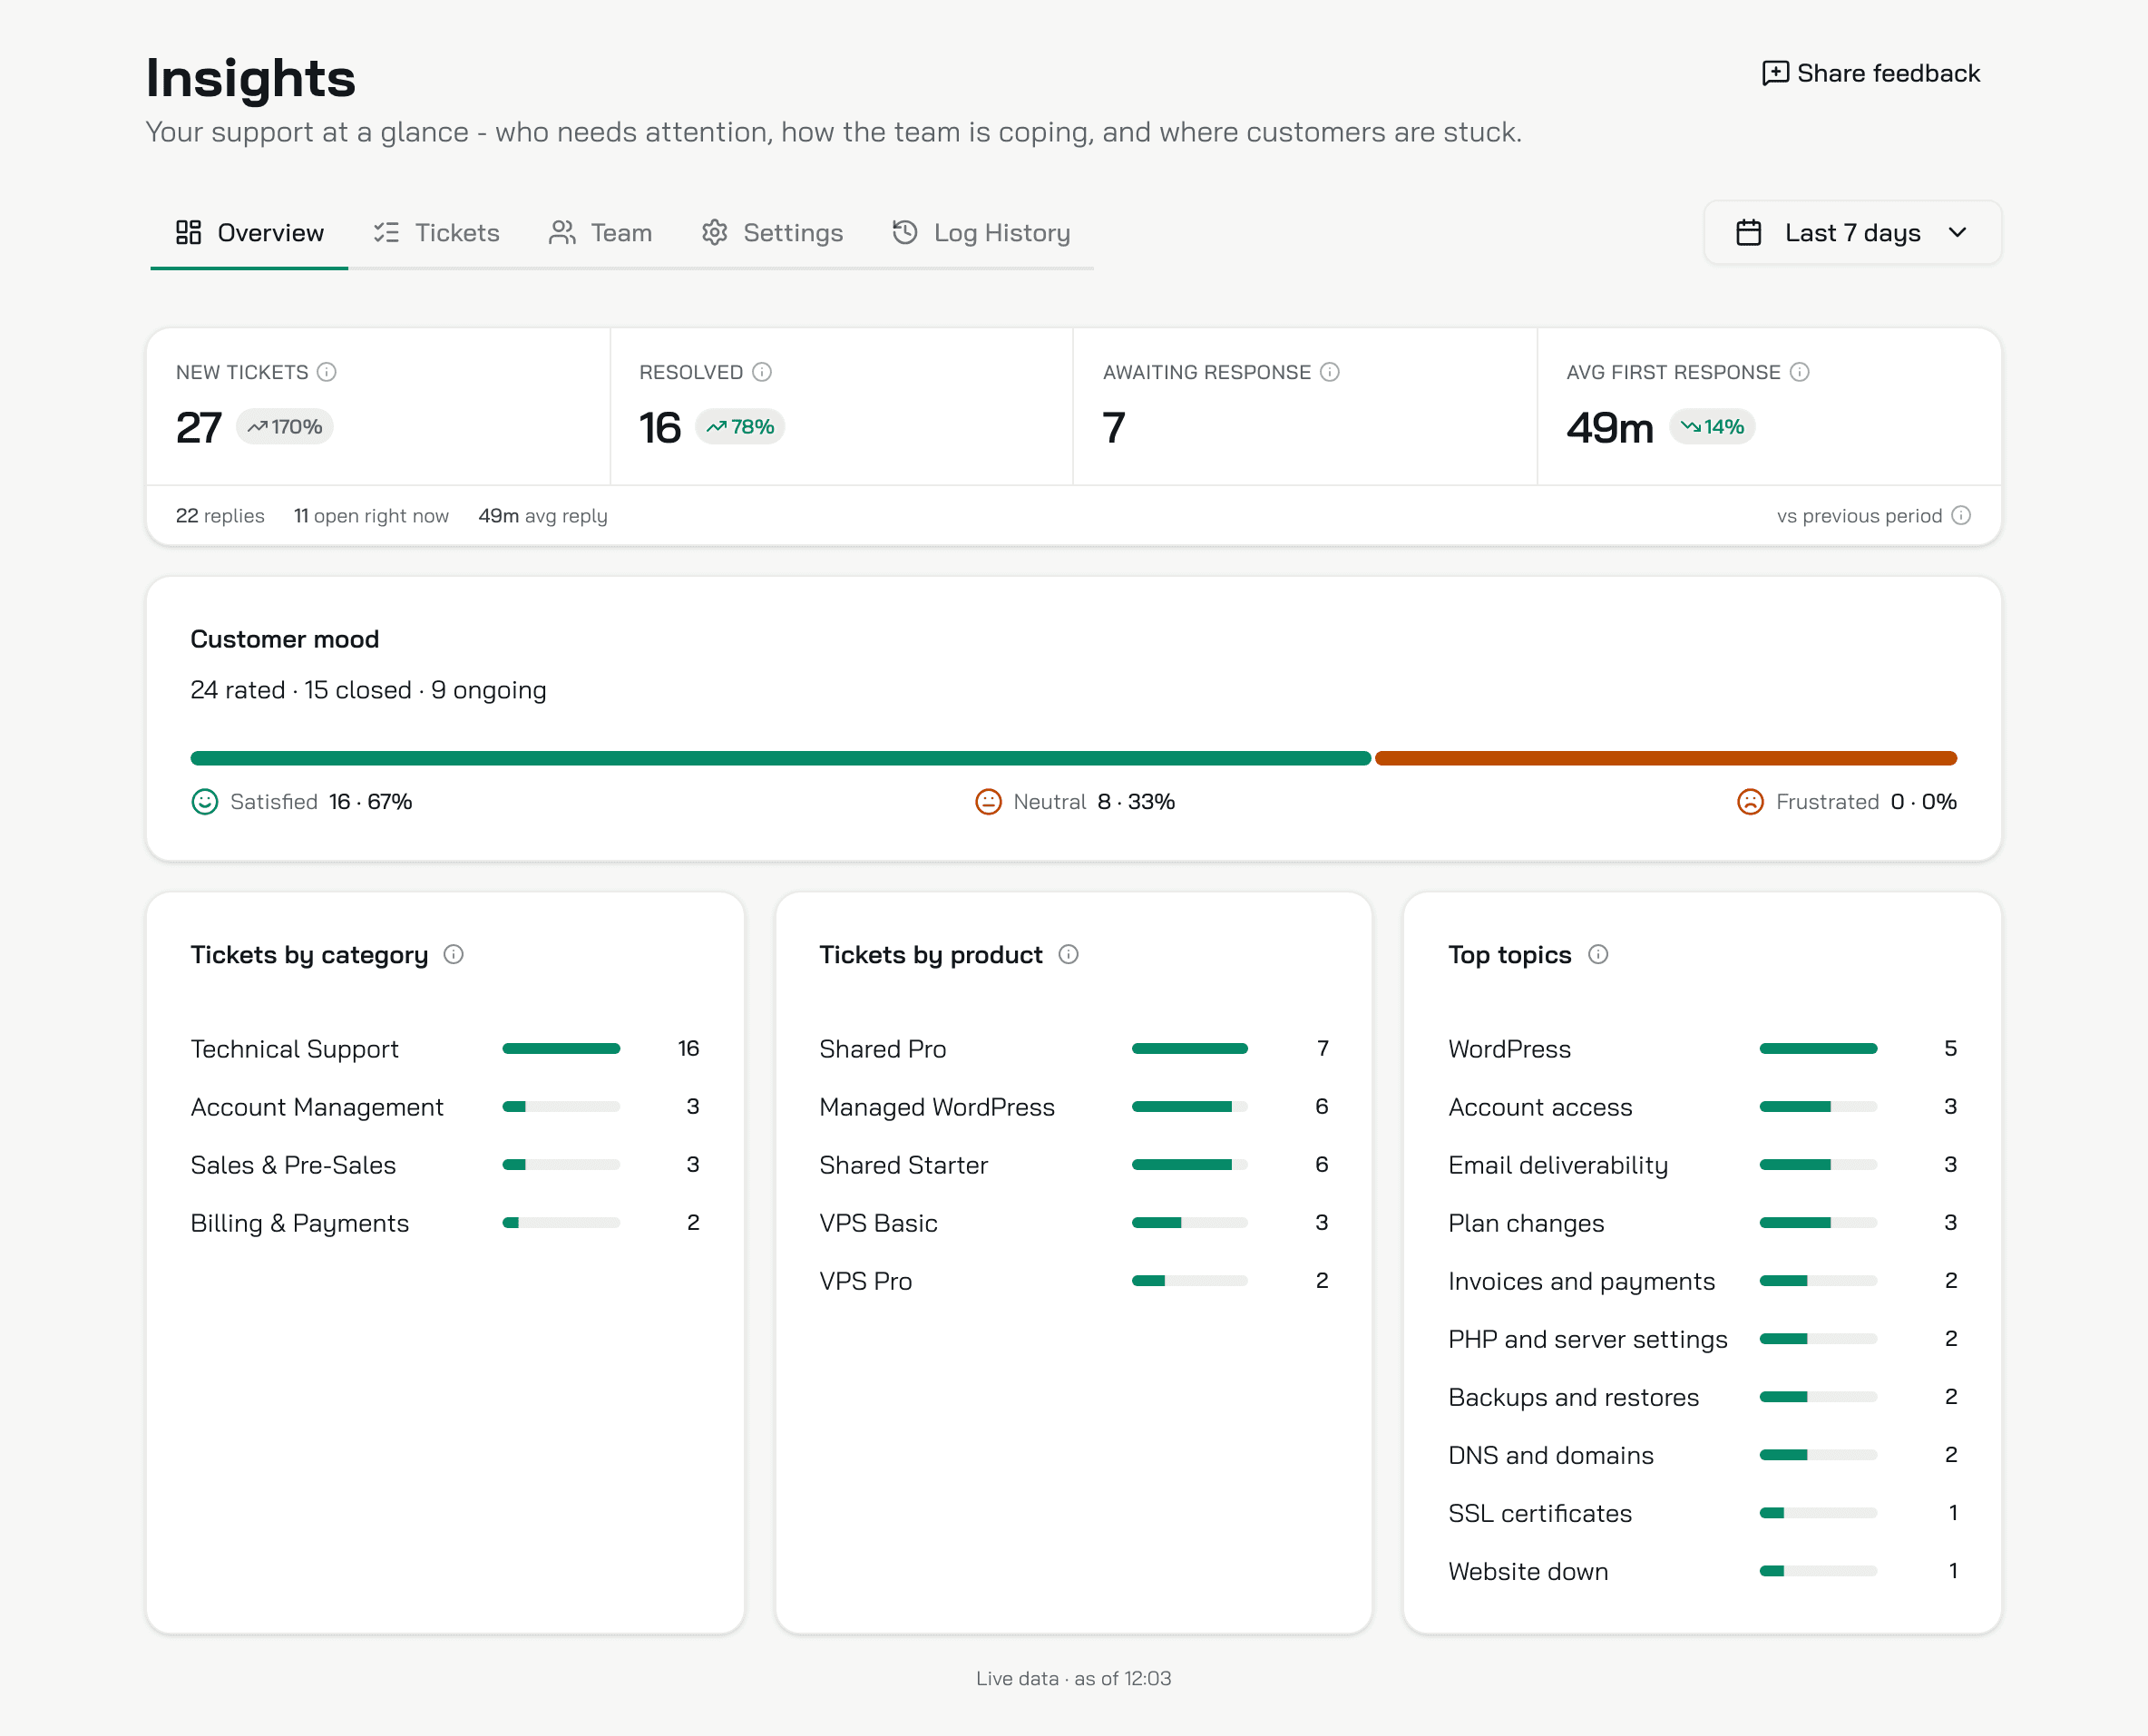
Five tabs: Overview, Tickets, Team, Settings and Log History.
Date range
Overview, Tickets and Team share a date range, top right, Last 7 days by default. Pick another preset, such as Yesterday, Last 30 days or Last month, or Custom range... for a calendar with optional times. The range is part of the page address, so a copied link keeps it.
Overview
The four numbers
| Number | What it counts |
|---|---|
| New tickets | Tickets created in the range |
| Resolved | Tickets closed in the range, whenever they were created |
| Awaiting response | Open tickets from the last 30 days where the customer waits on your team. It ignores the range |
| Avg first response | The average time from a new ticket to its first reply, for the tickets created in the range that got one. Konrado's auto replies count |
Each number compares with the same length of time just before the range. New tickets shows the change in grey: volume is neither good nor bad. On Resolved and Avg first response, green is better and red is worse. Awaiting response has no comparison.
The line under them adds three more:
- replies: the replies sent in the range, Konrado's included.
- open right now: the tickets created in the range and not closed by its end.
- avg reply: the average time from a customer message to the next reply.
Click New tickets, Resolved, Awaiting response or open right now to open its tickets in Tickets. That list filters by the day a ticket was created, so it can differ from the count.
Customer mood
Konrado rates each ticket Satisfied, Neutral or Frustrated. A closed ticket gets one score, 0 to 100. It weighs how well the problem was solved, how well the replies fit, the customer's effort and their tone. 70 and up is Satisfied, 40 to 69 Neutral, under 40 Frustrated. An open ticket takes the mood of the customer's latest message.
The card counts the tickets created in the range: how many are rated, closed and ongoing. Click a mood to see its tickets.
Category, product and topic
- Tickets by category: Konrado's main category for each ticket.
- Tickets by product: the products of the client's services that Konrado tied to the ticket. Domains are left out.
- Top topics: what customers wrote about, grouped into your recurring topics. Konrado writes a short topic for every ticket, and each night groups them into a small set of names for your organization. There is no list to set up.
Each card shows its top 10, and Show N more opens the rest. Click a row to see its tickets.
Konrado keeps the numbers for 15 minutes, so a new ticket can take that long to show.
Tickets
Every ticket created in the range. A row shows Konrado's subject and a two-line summary, the ticket number, the client, the category, the mood, and the client's monthly spend when their paid services are known. Then the Status, and Last activity: when Konrado wrote the latest draft that got a reply, or when the ticket arrived.
Hover the initials for the client's details. The subject and the number open the ticket page, and the icon opens the ticket in your help desk. See what the ticket page shows.
- Search tickets... finds a ticket number, a subject or any message text.
- Status filters by status. Add filter adds Mood, Category, Topic and Awaiting reply.
- A click on the Overview or on a name in Team adds Product or Agent.
- Reset clears the filters and the search, and keeps the range.
Team
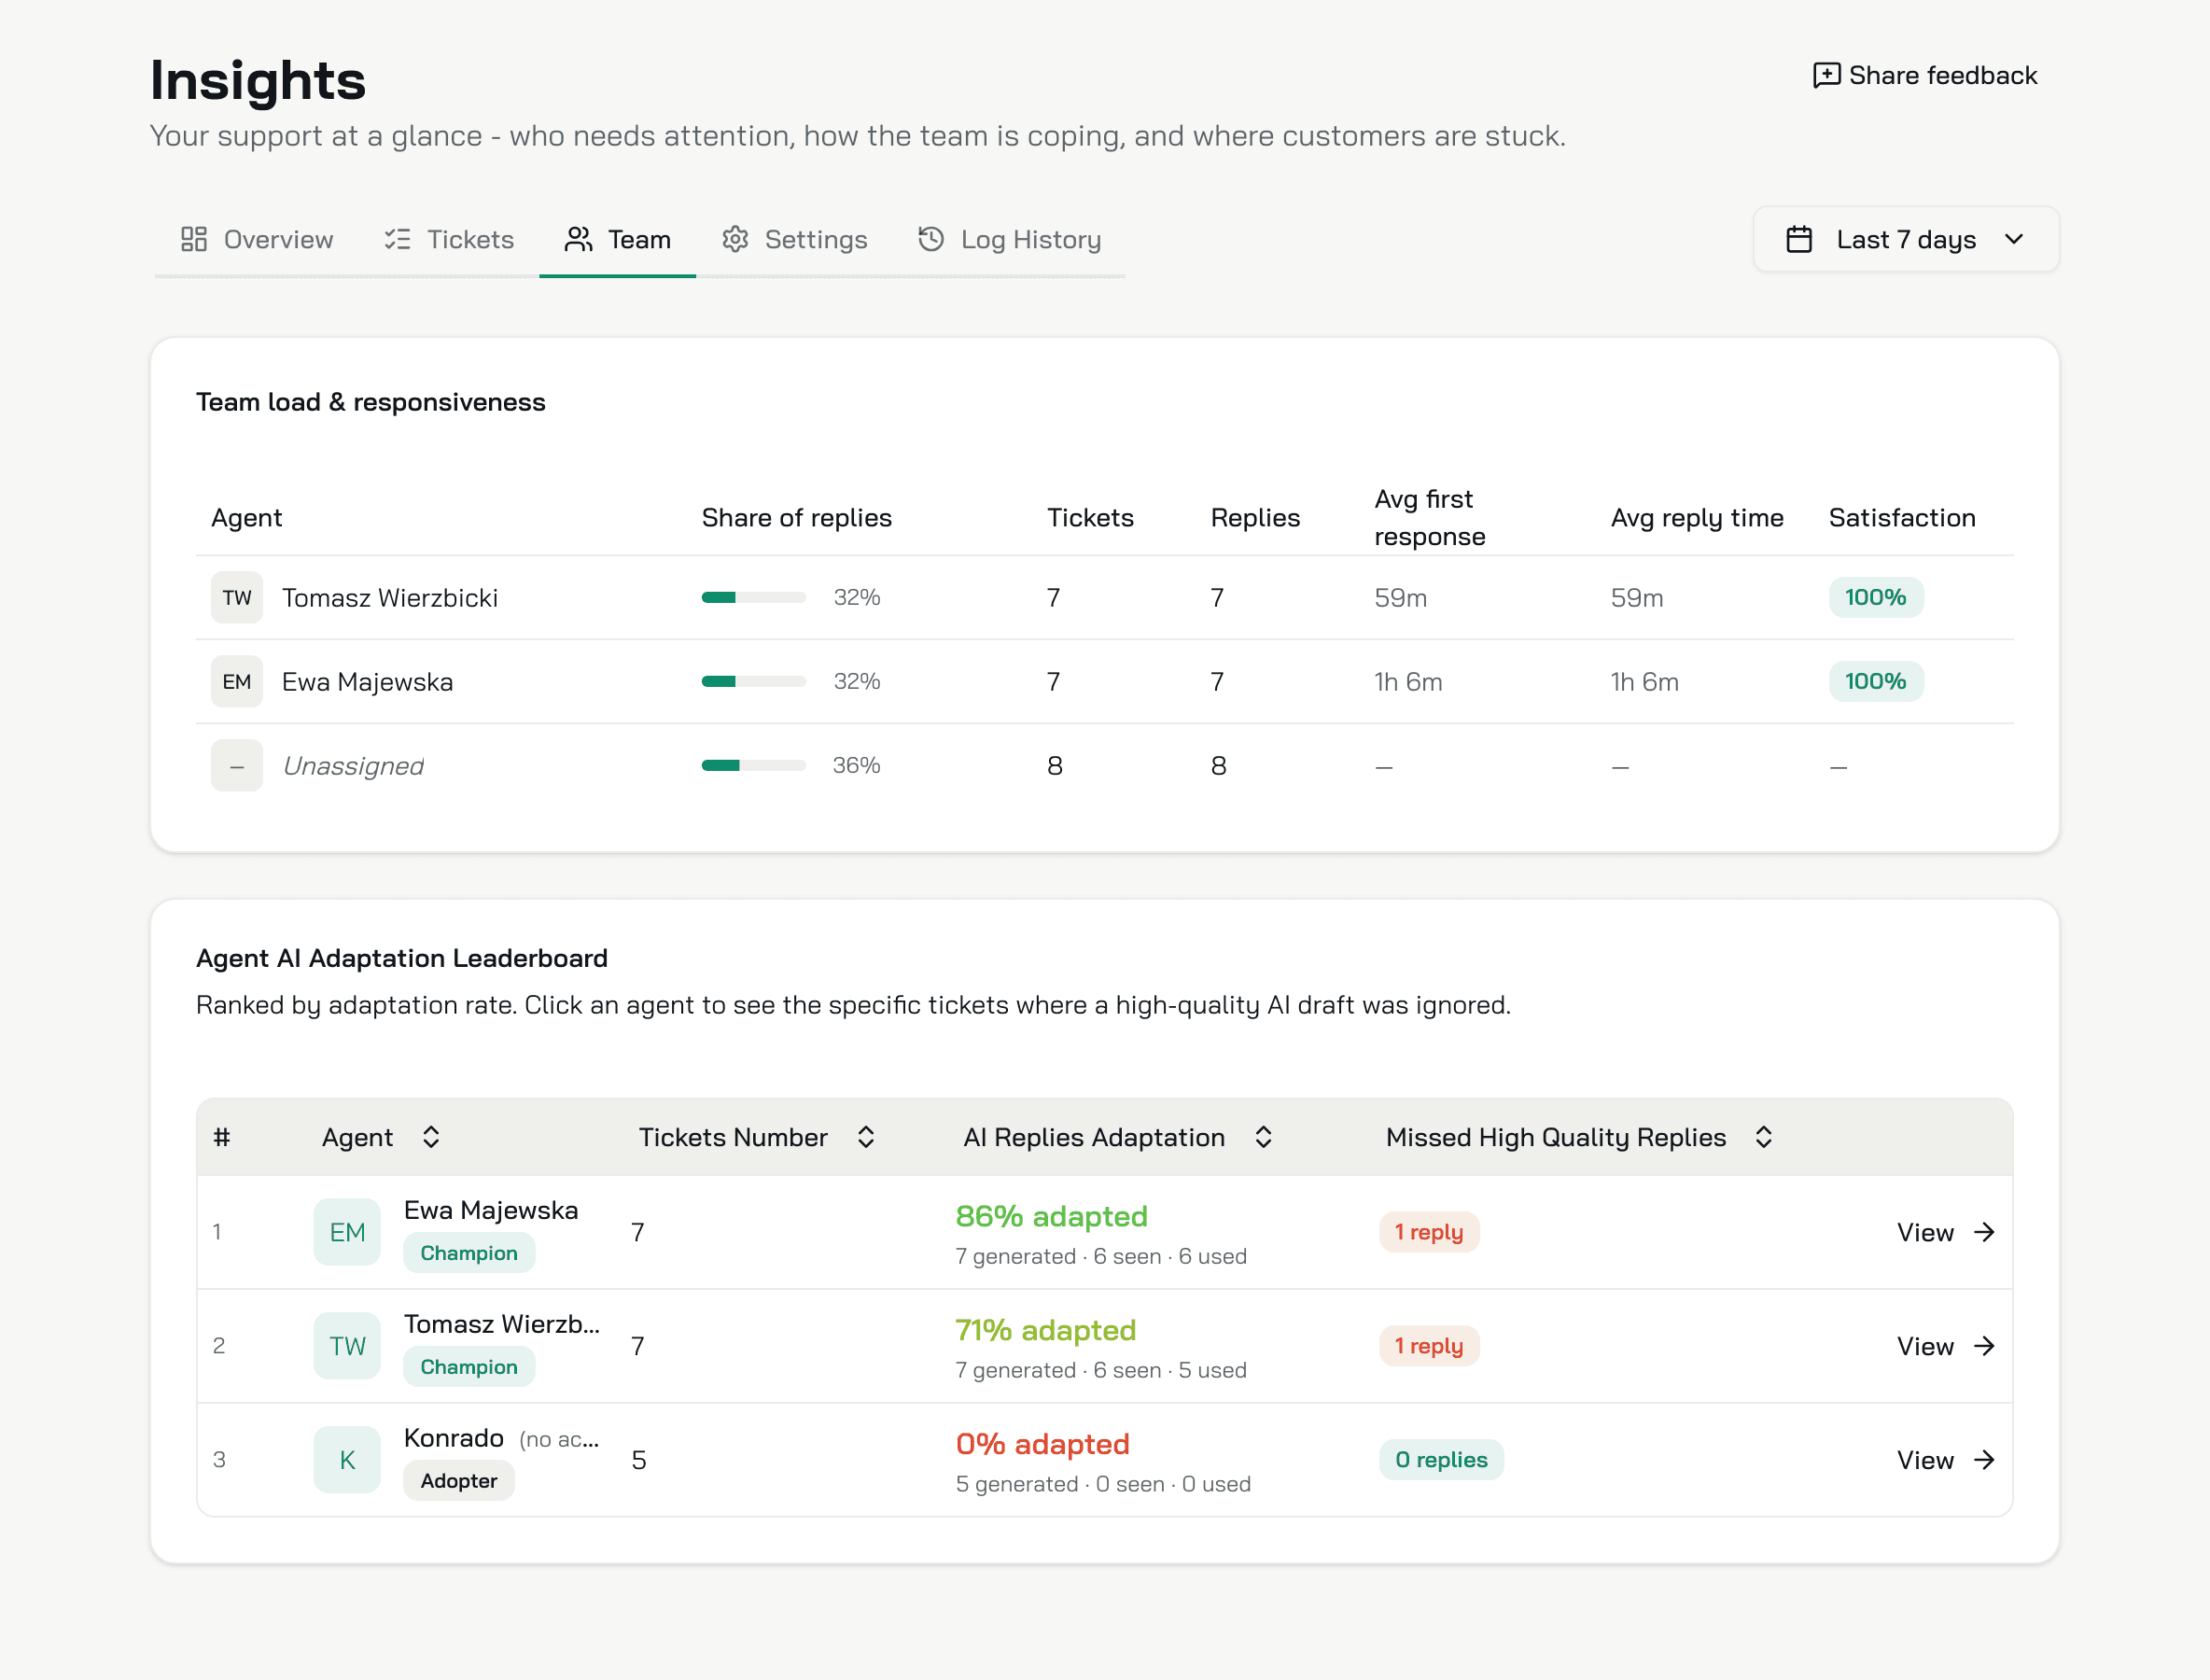
Team load and responsiveness
Every reply sent in the range, by person.
| Column | What it shows |
|---|---|
| Agent | The person, as your help desk names them. Click the name for the tickets they replied to |
| Share of replies | Their share of all replies |
| Tickets | The tickets they replied to |
| Replies | The replies they sent |
| Avg first response | How long their first reply on a ticket took |
| Avg reply time | How long they took to answer a customer message |
| Satisfaction | The share of their rated tickets that are not Frustrated. Green at 70% and up, amber from 40%, red below |
Unassigned holds the replies your help desk did not tie to a person Konrado knows. Its times and satisfaction stay empty. The replies Konrado sent on its own land there, or on a row of their own with the Auto-replies badge.
Agent AI adaptation leaderboard
One row per person who answered a ticket Konrado had drafted a reply for.
- Tickets Number: the tickets they answered.
- AI Replies Adaptation: the share of Konrado's drafts they used, with how many were generated, seen and used. A draft counts as seen when the person opened it or asked for it. It counts as used when they saw it and their reply still resembles it, a wording match above 30 out of 100.
- Missed High Quality Replies: the drafts that said the same as their reply, 80% or more by meaning, while their wording matched 30 out of 100 or less.
| Badge | When |
|---|---|
| Champion | 70% of the drafts used, or more |
| Adopter | 40% or more, or fewer than 10 drafts |
| Resistor | Under 40%, with 10 drafts or more |
| Inactive | No drafts |
A person with no Konrado account shows (no account). Konrado cannot see whether they read a draft, so their rate stays at 0%. Konrado's own auto replies can appear as such a row. Its rate and badge say nothing about your team. View opens a person's page.
A person's page
The same three numbers, then Reply History with two tabs, Missed Replies and All Replies. Compare shows Konrado's draft next to what they sent. The page keeps the range you came with, or shows the last 30 days. A person with no Konrado account has no reply history.
Settings
The email report. Two cards, Daily Report and Weekly Report, each with a switch. Switch a report on to see its fields:
- Send Time, by the hour, in your browser's time zone. The weekly report adds Send Day.
- Recipients: people in your organization, or any address you type, up to 50 per report.
- A change opens Unsaved changes. Click Save, or Reset to drop it.
- A report that is on with nobody in Recipients shows Nobody will receive this.
The daily report covers yesterday. The weekly report covers Monday to Sunday of the week before, whatever day it goes out.
The email holds the four numbers, Key Insights, the customer mood, the top topics, the team table and the top products. Key Insights lists up to 5 themes Konrado reads from the tickets, and any alert that needs your action.
Two things differ from the console. In the email, Awaiting Response counts only the tickets created in the report's period. In the console, This week and Last week start on Sunday, while the weekly report starts on Monday.
Log history
One row per report: Type, Status, Recipients, Period and Sent.
| Status | What it means |
|---|---|
| Sent | Konrado handed the email over for delivery |
| Skipped | The report had no recipients |
| Failed | Konrado could not build the report |
| Send Failed | Konrado built the report but could not hand the email over |
| Computed | Built, not handed over yet |
How to read a week
Open Overview on Last 7 days, once a week.
- Awaiting response: who waits on your team right now. Click it to see them.
- Customer mood: click Frustrated. The monthly spend on each row shows whom to call first.
- Top topics: compare with Last week. A topic that grows can be a question your help pages do not answer yet, or a problem on your side.
- Resolved and Avg first response: red on both means your team closed fewer tickets, and answered later, than the week before.
- Team: compare Avg first response per person. Open anyone with Missed High Quality Replies and click Compare.
What Konrado cannot do
| Not possible | Why |
|---|---|
| Count live chat conversations | Insights reads help desk tickets. Chats are in the Inbox |
| Show one help desk's numbers | Every number covers all the help desks of your organization |
| Rename or merge a topic | Konrado names the topics itself, each night |
| Show a sent email again | Log History lists the reports, not their content |
| Open the email's period from its links | The links open Insights on its default range. Pick the period in the date range |
| Survey your customers | The mood is Konrado's reading of each ticket |
Related
Last updated on