Reports
Monitor AI performance, response quality, and team adoption metrics
The Reports section gives you visibility into how Konrado.AI is performing and how your team is using AI-generated responses.
For operational support metrics — volume, customer mood, topics, and team load — see Insights.
What This Helps You Improve
Reports turn day-to-day support usage into a feedback loop. Use them to decide whether to improve Knowledge Base content, adjust Tweaking instructions, connect more integrations, or change automation thresholds.
Common Support Scenarios
| Scenario | Report signal |
|---|---|
| Agents ignore generated replies | Low adaptation rate or low seen/used counts |
| Replies are generated but often rewritten | Quality or adaptation trend drops after a change |
| New Knowledge Base content was added | Watch quality and missed replies for the next support cycle |
| Automation was enabled | Compare automated reply volume with quality and ticket outcomes |
Success Signals
- Adaptation rate trends upward or stays stable.
- Quality distribution improves after content and Tweaking updates.
- Ticket message count decreases for repetitive issues.
- Team usage grows as agents learn the workflow.
Overview
Navigate to Reports in the sidebar. The dashboard provides several report types to track different aspects of AI performance.
Available Reports
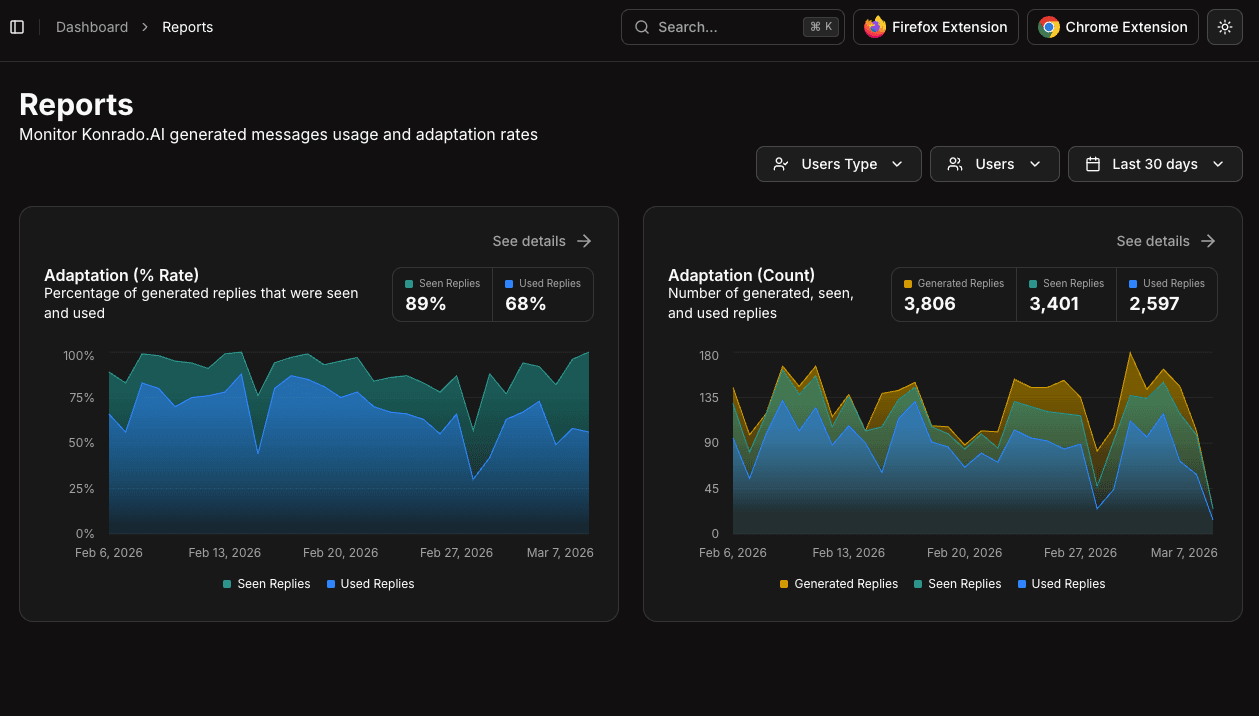
Adaptation Rate
Shows the percentage of AI-generated replies that were seen and used by your support team over time. This is your primary metric for AI adoption.
- High adaptation rate (above 70%) — The AI is producing useful responses your team trusts
- Low adaptation rate (below 30%) — Review your Tweaking instructions and Knowledge Base content
Adaptation Count
Displays absolute numbers of generated, seen, and used replies. Useful for understanding volume trends alongside the percentage-based adaptation rate.
Replies Quality
Breaks down AI-generated reply quality into categories:
- Quality Count — Absolute numbers of responses by quality tier
- Quality Percent — Percentage distribution of response quality
System Quality
Similar to Replies Quality, but focused on system-level generated responses:
- System Quality Count — Absolute breakdown
- System Quality Percent — Percentage breakdown
Ticket Messages
Shows the average number of messages per ticket over time. A decreasing trend indicates the AI is helping resolve issues faster with fewer back-and-forth exchanges.
Filtering
Use the controls at the top of the page to narrow your data:
- Users Type — Filter by user role
- Users — Select specific team members
- Date Range — Choose a time period (e.g., Last 30 days)
Each report card shows a summary with key metrics and a time-based chart. Click See details on any card to drill into the full report.
Using Reports for Optimization
Reports are your feedback loop for continuous improvement:
- Weekly review — Check adaptation rate trends to catch regressions early
- After Knowledge Base updates — Monitor if new content improves response quality
- After Tweaking changes — Verify that instruction changes have the desired effect
- Team onboarding — Track adoption as new team members start using the extension
Weekly Review Checklist
- Review adaptation rate for the last 7 and 30 days.
- Open low-quality or missed-reply tickets and identify the missing context.
- Add or update Knowledge Base pages for repeated gaps.
- Convert repeated agent edits into Tweaking instructions.
- Check whether server or ticketing integrations had connection errors.
- Adjust automation thresholds only after quality trends are stable.
Reports data is available as soon as tickets are processed. There's no delay — metrics update in real-time.